
LaTeX2Web, a web authoring and publishing system
If you see this, something is wrong
Collapse and expand sections
To get acquainted with the document, the best thing to do is to select the "Collapse all sections" item from the "View" menu. This will leave visible only the titles of the top-level sections.
Clicking on a section title toggles the visibility of the section content. If you have collapsed all of the sections, this will let you discover the document progressively, from the top-level sections to the lower-level ones.
Cross-references and related material
Generally speaking, anything that is blue is clickable.
Clicking on a reference link (like an equation number, for instance) will display the reference as close as possible, without breaking the layout. Clicking on the displayed content or on the reference link hides the content. This is recursive: if the content includes a reference, clicking on it will have the same effect. These "links" are not necessarily numbers, as it is possible in LaTeX2Web to use full text for a reference.
Clicking on a bibliographical reference (i.e., a number within brackets) will display the reference.
Speech bubbles indicate a footnote. Click on the bubble to reveal the footnote (there is no page in a web document, so footnotes are placed inside the text flow). Acronyms work the same way as footnotes, except that you have the acronym instead of the speech bubble.
Discussions
By default, discussions are open in a document. Click on the discussion button below to reveal the discussion thread. However, you must be registered to participate in the discussion.
If a thread has been initialized, you can reply to it. Any modification to any comment, or a reply to it, in the discussion is signified by email to the owner of the document and to the author of the comment.
Table of contents
First published on Friday, Nov 22, 2024 and last modified on Thursday, Apr 10, 2025 by François Chaplais.
I am normally hidden by the status bar
Published version: 10.1109/isap57493.2023.10388794
Department of Electrical Engineering, University of Twente, Enschede, Netherlands, Email. The work of Alejandro Antón is supported by the European Union’s Horizon 2020 Marie Skłodowska-Curie grant agreement No. 955629.
Bluetest AB, Gothenburg, Sweden, [email protected]
Bluetest AB, Gothenburg, Sweden, [email protected]
Bluetest AB, Gothenburg, Sweden, [email protected]
University of Twente, Department of Science and Technology, Linköping University, Norrköping Campus, Sweden Email. Andrés Alayón Glazunov also kindly acknowledges funding from the ELLIIT strategic research environment https://elliit.se/
OTA, reverberation chamber, phased array, mmWave, TRP
Abstract
This paper explores the use of reverberation chambers for TRP measurements of beamformed radiation by phased arrays at mmWave frequencies. First, the received power was verified by the one-sample K-S GoF test to follow the exponential probability distribution. Different numbers of samples and stirrers’ positions were considered. Second, we showed that the effective number of independent samples is different depending on the number of samples and stirrers’ positions. Third, the beamforming TRP estimates are presented for all beams, analyzing the statistical significance of the observed differences with a selection of samplings.
1 Introduction
Phased arrays are a 5G enabling technology exploiting the mmWave spectrum, overcoming the propagation loss. OTA performance evaluation is a key aspect in developing, producing, and deploying antennas. The radiated performance of a wireless device is fundamentally described by its TRP. For phased arrays TRP is important from the energy efficiency point of view and also due to regulatory and interference restrictions. The quality of the AUT can be assured, e.g., by evaluating TRP performance consistency among beams or comparing against a golden device. It is widely known that an RC is much more efficient in evaluating TRP as compared to anechoic chamber measurements. Works presenting mmWave phased arrays measurements in RC are not new [1, 2]. However, to the best knowledge of the authors, there are no works of TRP measurements of active phased arrays at mmWave in RC. Thus, this work aims at filling this gap.
2 Measurement setup and procedure
2.1 Phased array antenna
An evaluation kit (EVK02001), with RF module (BFM02003) from Sivers Semiconductors AB and its own continuous wave source restrictions, is used in this study [3]. It operates between \( 24-29.5\) GHz. The BFM02003 has two identical modules, each with \( 2\) rows of \( 8\) linearly polarized patch AE. The RX and the TX have 16 AE each. Only the TX module is used here and evaluated at \( 28\) GHz. The azimuth scanning covers from \( -45^{\circ}\) to \( +45^{\circ}\) with \( 4.5^{\circ}\) step size. Thus, it produces 21 different beams, denoted as beam 1 starting from \( -45^{\circ}\) and so on.
2.2 Reverberation chamber and instruments
The OTA TRP experiments were performed with an RTS65 RC from Bluetest AB. RTS65 is capable of mmWave measurements up to \( 43.5\) GHz and is equipped with two linearly polarized measurement antennas. Here, only one of them was used. Note that the RC achieves polarization balance. TRP calibration requires measuring the chamber loss. This was done using a reference horn antenna and a VNA, keeping inside the RC the phased array and its fixture. Then, the TRP measurement of the AUT was performed with chamber loss compensation, using a signal and spectrum analyzer. This was repeated for the 21 beams collecting 600 samples per beam. Each sample corresponds to different positions of two different mechanical stirrers, i.e., a turntable moving in the outer loop and with a \( 14.4^{\circ}\) step size, and vertical and horizontal metal paddles, moving in the inner loop. Beam switching was done in the outermost loop. Specifically, the first 25 samples differ in paddle positions and share the same turntable position. The next 25 samples share a new position of the turntable and so on. After 600 samples are taken, beam switching occurs.
3 Results
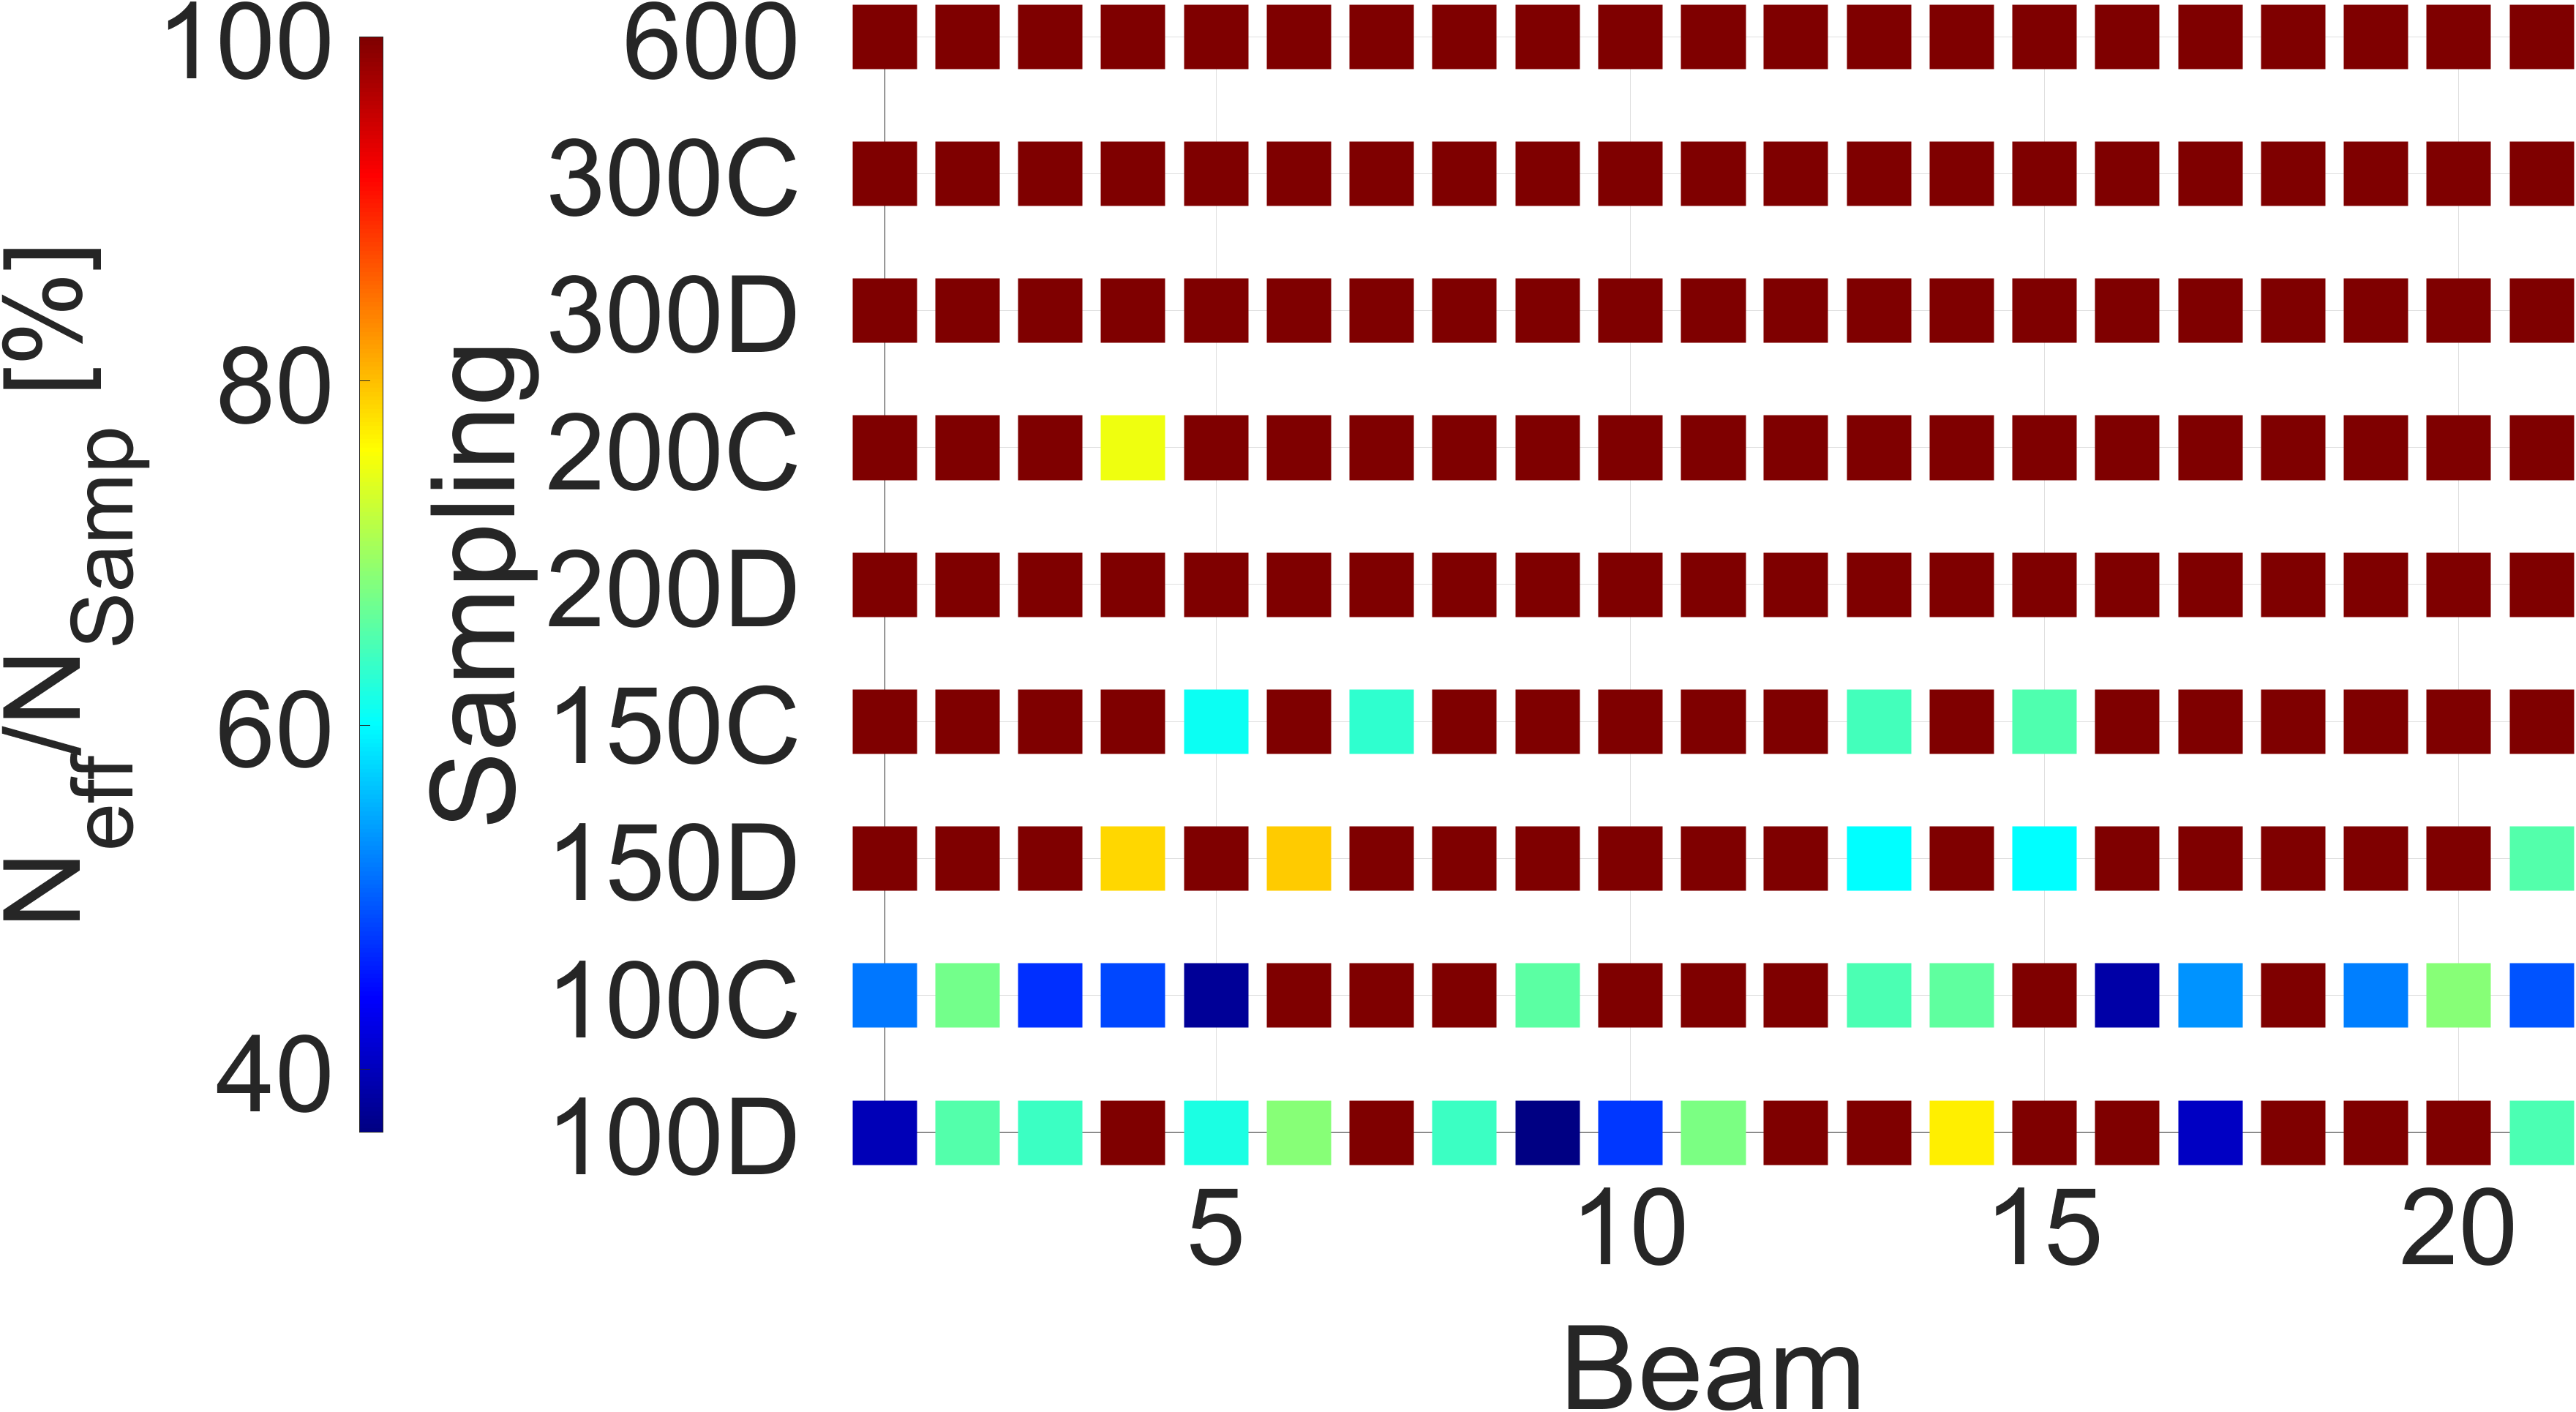
Various numbers of samples were considered: 100, 150, 200, 300, and 600. The smaller sample subsampling sets are taken from the same initial 600 samples. Two subsampling approaches were considered: (i) contiguous (C) (e.g., the first 300 samples are kept), and (ii) decimated (D) (e.g., only every 2\( ^{\textrm{nd}}\) sample is kept starting from the first one). Note that subsampling (i) does not cover the whole circle (\( 0^{\circ}\) to \( 331.2^{\circ}\) ) of the turntable rotation while subsampling (ii) does. The gathered samples are [1 2…600] (600), [1 2…300] (300C), [1 3…599] (300D), [1 2…200] (200C), [1 4…598] (200D), [1 2…150] (150C), [1 5…597] (150D), [1 2…100] (100C), [1 7…595] (100D), where C and D denote subsampling-(i) and –(ii), respectively.
3.1 Goodness of fit test
The PDF of the received signal power measured in a well-stirred RC must follow the exponential distribution. The one-sample K-S test is applied at the \( 5\%\) significance level. For all the considered samplings, the test could not reject the hypothesis that the samples come from an exponential distribution. Thus, even if the turntable rotation is partial, e.g., the 100C case covering \( 43.2^\circ\) of the turntable rotation, the PDF is most likely exponential.
3.2 Independent samples
IEC and 3GPP standards define how to measure the number of effective samples [4, 5]. The definitions are only valid for one tuner and equidistant tuner positions though. In [6], a circular-shift correlation matrix approach, suitable for more than one tuner compatible with [4, 5], is proposed. This approach is used here to produce results shown in Fig. 1, which indicate the percentage of effective samples \( N_{eff}\) , i.e., independent samples, relative to the considered samples \( N_{Samp}\) . As can be seen, reducing \( N_{Samp}\) implies a general reduction of \( N_{eff}/N_{Samp}\) . This is because the threshold established in [4, 5], also used in [6], valid for \( N_{Samp}\geq100\) at \( 95\%\) confidence level, becomes stricter with decreasing \( N_{Samp}\) . The relative accuracy of the TRP estimate, denoted as \( \widehat{TRP}\) , has a standard deviation given by \( \sigma=1/\sqrt{N_{eff}}\) [7]. Thus, the \( \widehat{TRP}\) from sets of samples with \( N_{eff}/N_{Samp}\) lower than 100%, will have a larger uncertainty at a given \( N_{Samp}\) . For this particular case, if one wants to assure a given level of \( \sigma\) governed by \( N_{Samp}\) (\( N_{eff}=N_{Samp}\) ), then \( N_{Samp}\) will need to be at least 300 (or 200 using the 200D sampling).
3.3 TRP statistics
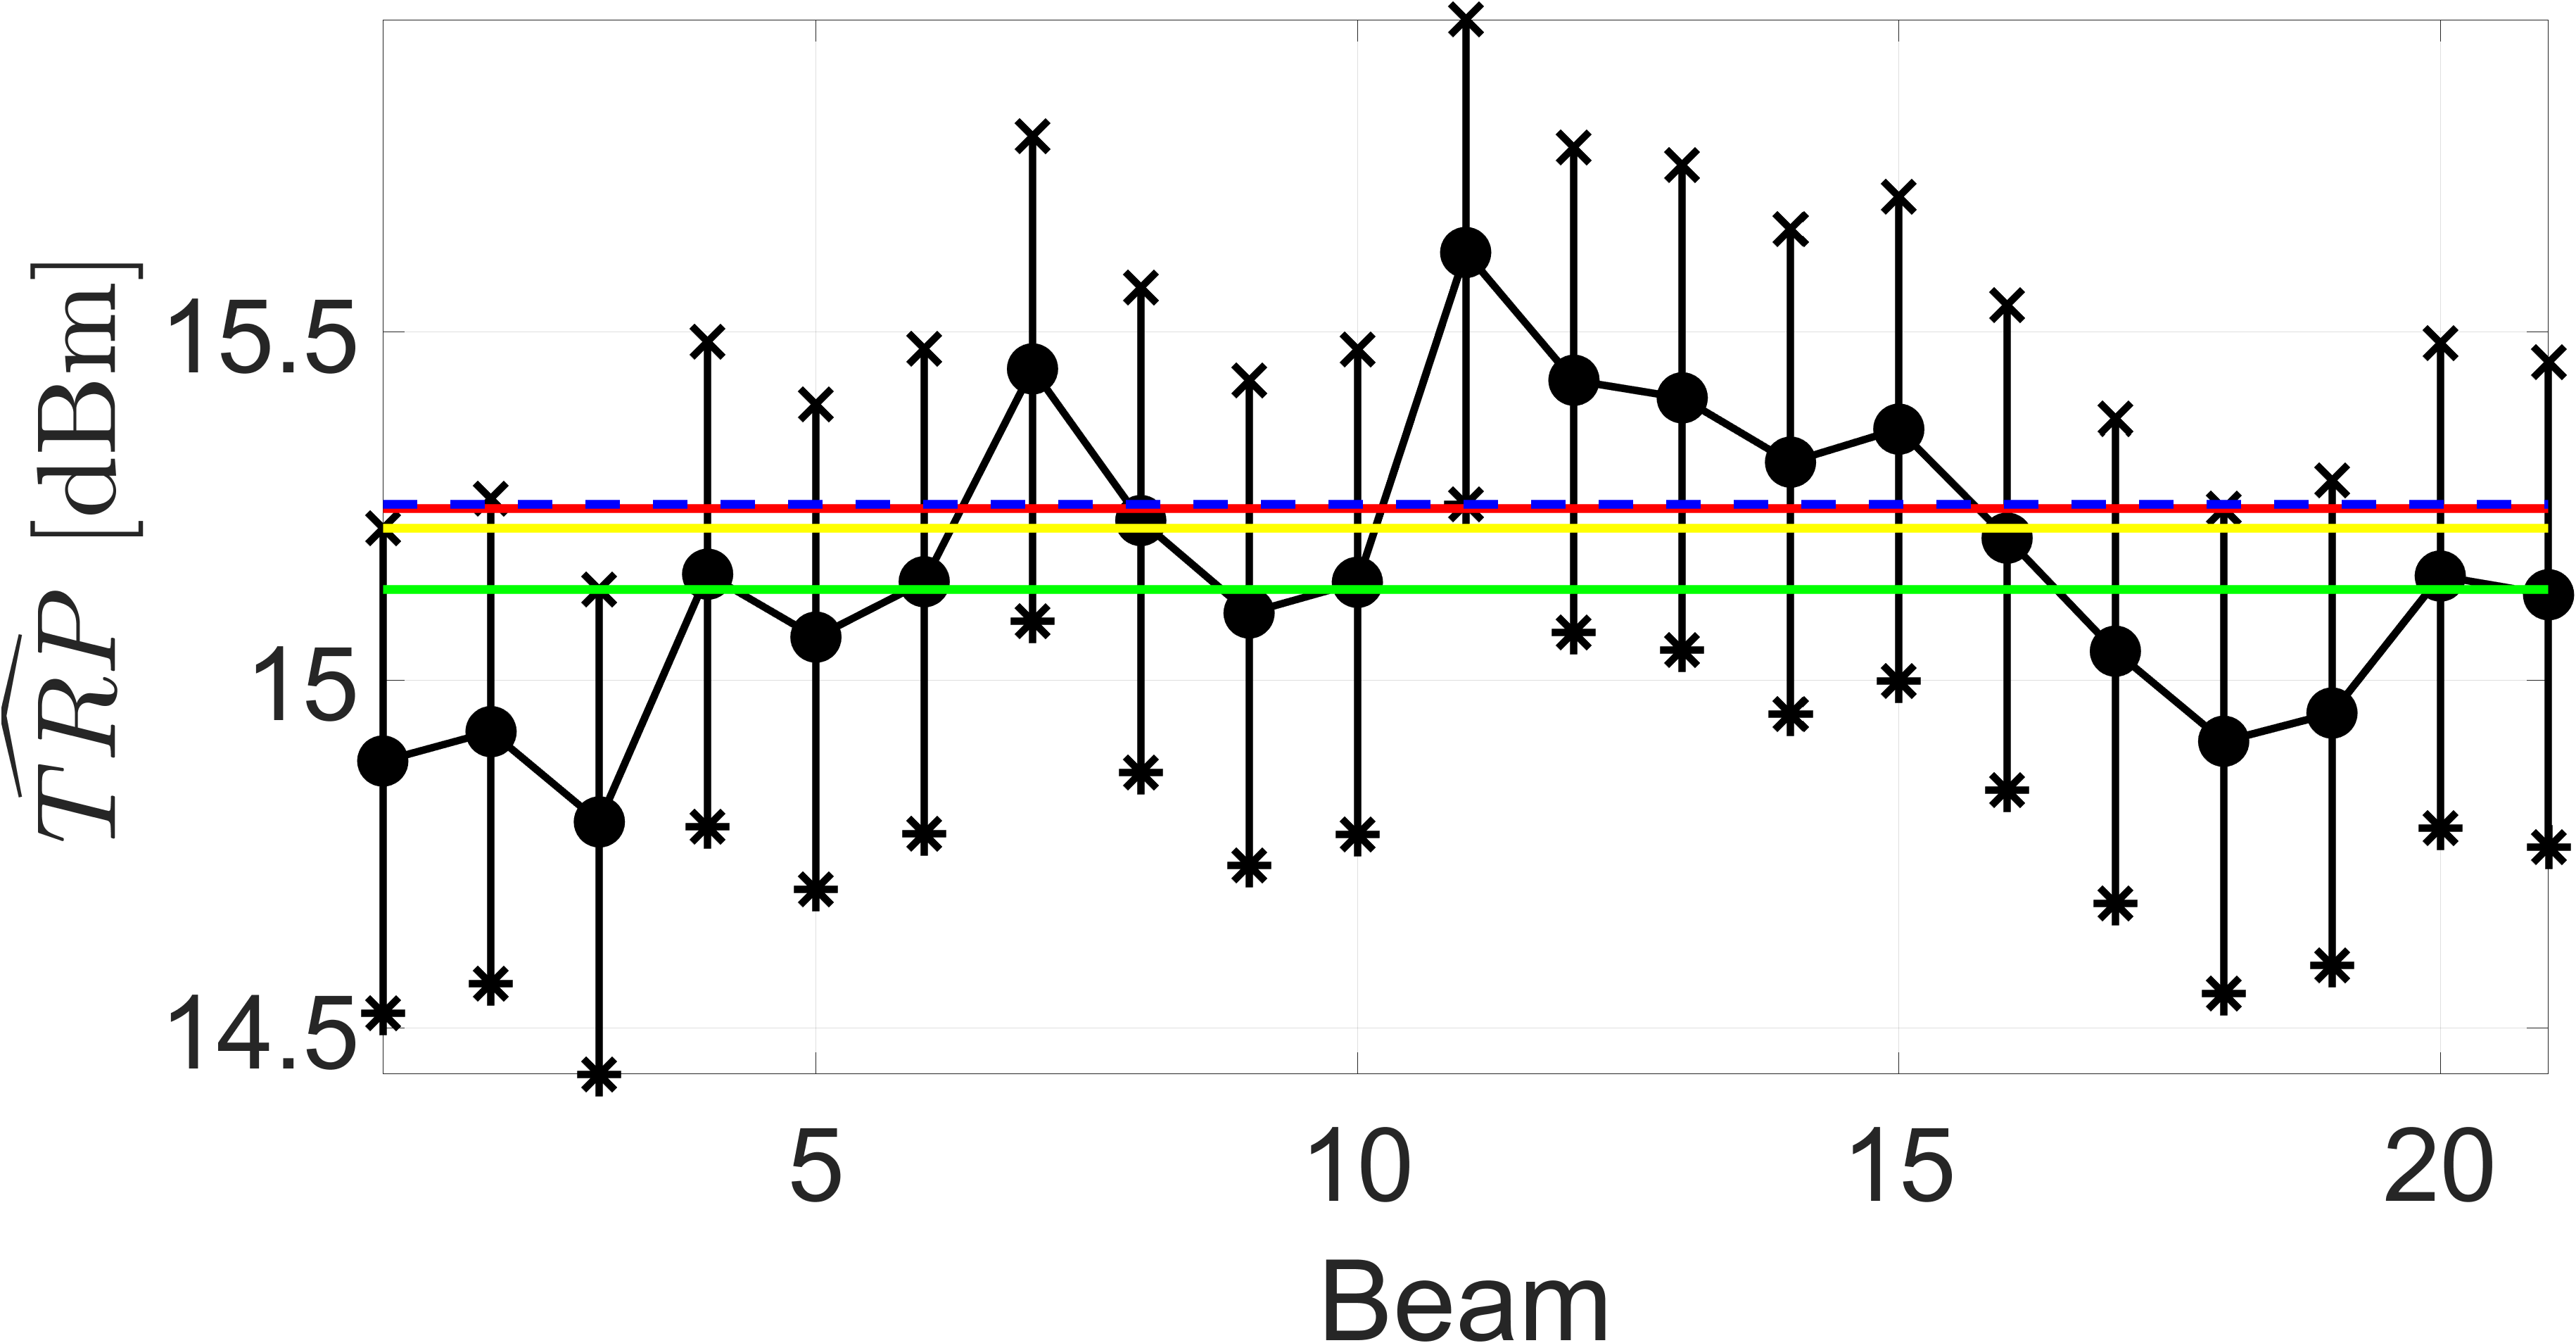
Fig. 2 shows the \( \widehat{TRP}\) and the \( 95\%\) CI for the 600 sampling, which has \( N_{eff}=N_{Samp}\) for all beams. To affirm that there is a significant statistical difference (with \( 95\%\) confidence) between values of \( \widehat{TRP}\) from different beams, no overlap between their respective CI can exist, i.e., that the CI upper bound of a given \( \widehat{TRP}\) is larger than the CI lower bound of other \( \widehat{TRP}\) . For almost all cases, there is such overlap, meaning that there is no statistically significant difference at \( 95\%\) confidence level between most beams. Specifically, for the 600 sampling, only the \( \widehat{TRP}\) of beam 11 is larger than that of beams 1, 3, and 18 (see Fig. 2). In case we use the 300D sampling only the \( \widehat{TRP}\) of beam 3 is lower than in beams 11, 12, and 13. Finally, for the 300C sampling, the \( \widehat{TRP}\) of beam 11 is larger than in beams 2, 17, 18, and 19, and \( \widehat{TRP}\) of beam 7 is larger than in beam 18. Thus, the different samplings have an influence in the \( \widehat{TRP}\) statistically significant differences, but, overall, most \( \widehat{TRP}\) values of different beams cannot be considered different from each other. This indicates a good performance of the AUT, since a phased array should have the same TRP for all beams.
4 Conclusions
This paper has presented an analysis of per beam TRP measurements of an active phased array in an RC. The data can be assumed to be measured in RIMP. It has also been shown that \( N_{eff}/N_{Samp}\) depends on the sampling procedure and no statistically significant differences of \( \widehat{TRP}\) have been found for most beams.
References
[1] A 5G Active Antenna Tile and its Characterization in a Reverberation Chamber 2020 14th European Conference on Antennas and Propagation (EuCAP) 2020 1-4 10.23919/EuCAP48036.2020.9135670
[2] Pushing the Boundaries of Antenna-Efficiency Measurements towards 6G in a mm-Wave Reverberation Chamber 2021 IEEE Conference on Antenna Measurements & Applications (CAMA) 2021 263-265 10.1109/CAMA49227.2021.9703514
[3] Sivers Semiconductors AB. (2020) EVK02001. Available online
[4] Testing and Measurement Techniques–Reverberation Chamber Test Methods, Standard IEC 61000–4-21 Jan 2011
[5] Radio Frequency (RF) conformance testing background for radiated Base Station (BS) Requirements (Release 17). Mar 2022
[6] Practical Correlation-Matrix Approaches for Standardized Testing of Wireless Devices in Reverberation Chambers IEEE Open Journal of Antennas and Propagation 2023 4 408-426 10.1109/OJAP.2023.3263055
[7] Measuring performance of 3GPP LTE terminals and small base stations in reverberation chambers Long Term Evolution Auerbach Publications 2016 427–472